WikiTree Network Degree Distribution
As promised, I will now present my first discovery based on analysis of the various WikiTree Networks which I described and clarified in previous posts!
Where do we even start when trying to analyze these mega-networks? As Bernard has repeated many times, there is no easy way to visualize these giant networks directly and many network algorithms do not scale well up to networks with millions of nodes. One common place that many researchers seem to start is analyzing the “degree distribution” of the network.
Definitions
The “degree” of a node is simply the number of edges connected to it or, equivalently, the number of neighboring nodes (nodes 1 step away). For example, in the below network: Node C has degree 5 (5 edges connect to it from nodes A, B, E, G, & J) and Node D has degree 1 (only 1 edge connects to it from E).
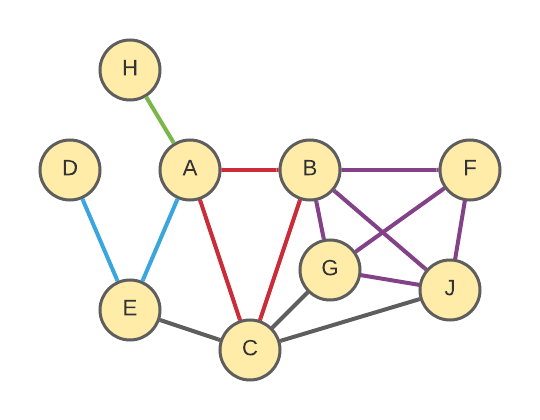
In the Person Network, the degree is the number of people linked from that person’s profile (in other words, the total number of parents, siblings, spouses and children). In the language of the 100 Circles project, it is the size of the first circle (C1).
The “degree distribution” of a network is a summarization of what percentage of nodes have each degree. For the example network (above), the degree distribution would be:
| Degree | % Nodes |
|---|---|
| 1 | 2/9 = 22% |
| 2 | 0/9 = 0% |
| 3 | 2/9 = 22% |
| 4 | 3/9 = 33% |
| 5 | 2/9 = 22% |
Degree distributions are most often represented as a plot.
WikiTree Degree Distributions
So, what do the degree distributions look like for our networks?
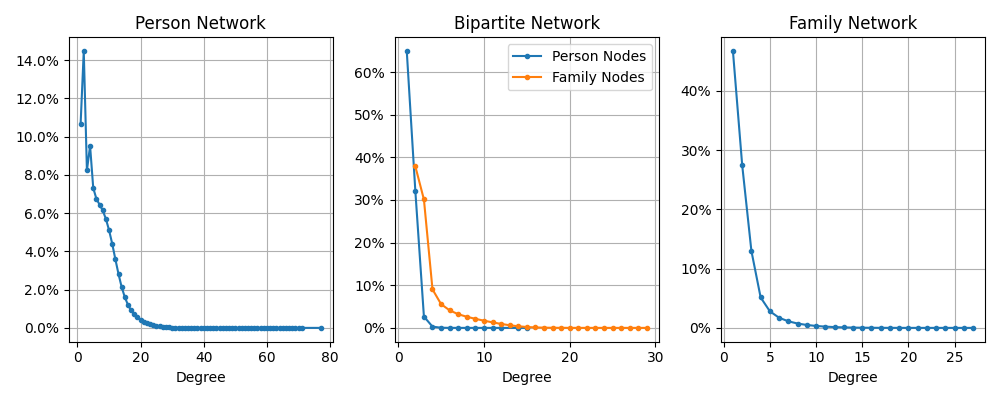
[Notice that for the Bipartite Network, I plotted the two different node types (Person & Family) separately because (as you can see) they have noticeably different distributions.]
OK, so what are we seeing here? Well they all have similar shapes. Tons of nodes with small degree (few neighbors) and then a drastic drop-off. As far as I can tell, this general description fits most networks. It’s extremely common for networks to have most nodes with small degree and quickly drop-off with only a few nodes having giant degree. But there are subtle differences in the shapes that these distributions can take that only become apparent once we use a different plotting scale. Let’s dig into each one separately:
Person Network
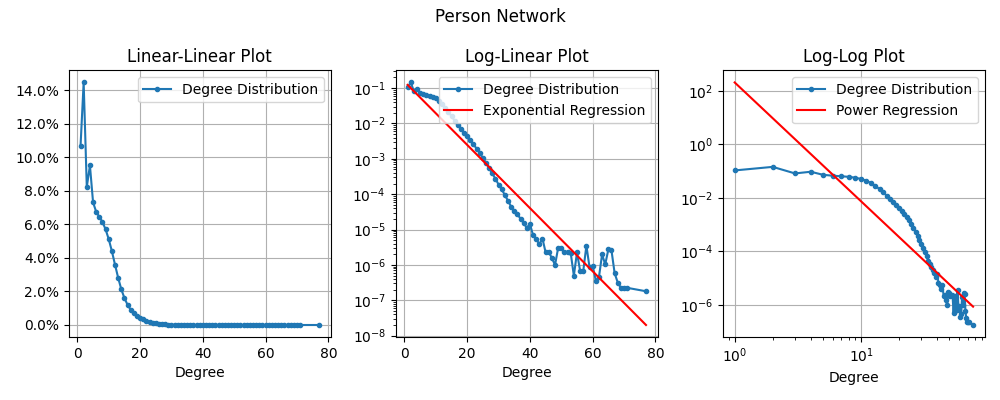
Alright, here we have the exact same data plotted in three different types of plots.
- On the left is the standard plot called Linear-Linear because the y-axis and x-axis both use linear scaling (spacing between 0% & 2% is the same as between 2% & 4%).
- In the middle is the same data plotted on a Log-Linear Plot. Here the x-axis (Degree) is still linear, but the y-axis is now using “logarithmic scaling”. First let me clarify how to read the y-axis: 10-1 = 1/10 = 10%; 10-2 = 1/100 = 1%; 10-3 = 1/1000 = 0.1%; … 10-6 = 1/1,000,000 (one in a million). So, this plot lets us see a lot more detail throughout the whole distribution even though it drops off so quickly! The red line here is a regression line which is the “best” line that fits the data. For a log-linear plot, this is called an “Exponential Regression”. If the data matched the regression line closely we would say that it has an “Exponential Degree Distribution”. In this specific case, it looks like a bit of a match, but not the best.
- Finally, on the right is the same data plotted on a Log-Log Plot. Here the y-axis is logarithmic scale again, but now the x-axis is also logarithmic scale. For log-log plots, the regression line represents a “Power Regression” and if the data matches that line, we say that it has a “Power-law Degree Distribution”. In this specific case, it looks like a terrible match.
Why have a chosen these specific plots? Well it turns out that “Power-law Degree Distributions” are extremely common and well studied in Network Theory. The “Exponential Degree Distribution” is definitely not as famous, but it also seem to come up again and again in the literature.
Bipartite Network
Here are the same plots for the Bipartite Network. I’ve completely separated it so that we look at only the Person Nodes first and then only the Family Nodes since their distributions are much different.
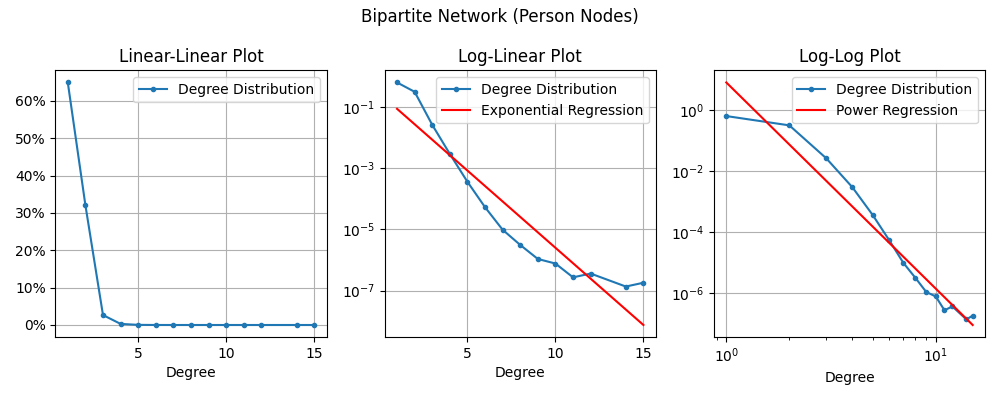
For the Bipartite Network, the degree of a Person node is the number of “Family units” a person is part of. So for a person who never marries or has children, they will have degree 1 (their birth family). If a person marries once, they will have degree 2 (birth and marital family). And each additional marriage adds 1 to the degree.
Neither of these regression lines look great to me, but it does sort of look like the Power Regression might apply if we ignored the left-most and right-most points.
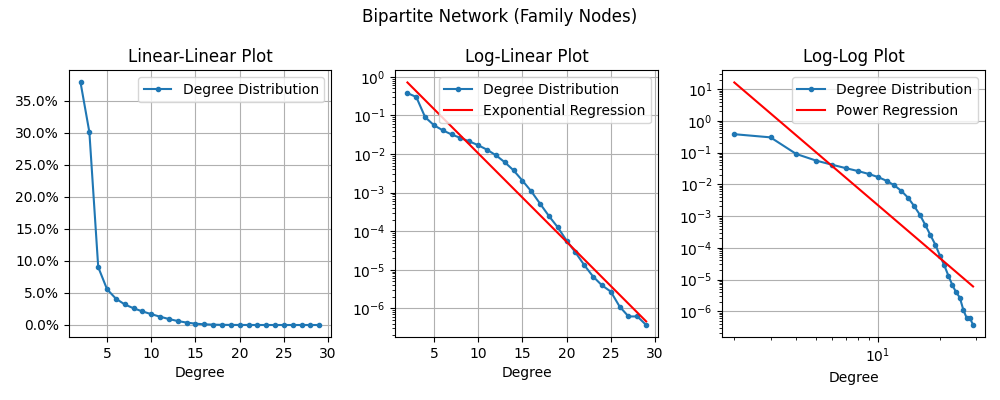
For Family nodes in the Bipartite Network, the degree is the number of people in that family unit. In other words, the number of parents (2) + the number of children.
The Exponential Regression looks pretty decent, the Power Regression is definitely bad.
Family Network
For the Family Network, the degree is the number of “family units” connected to this one. Specifically, the number of childhood families of the parents (2 if they’re documented on WikiTree) + the number of families the children start.
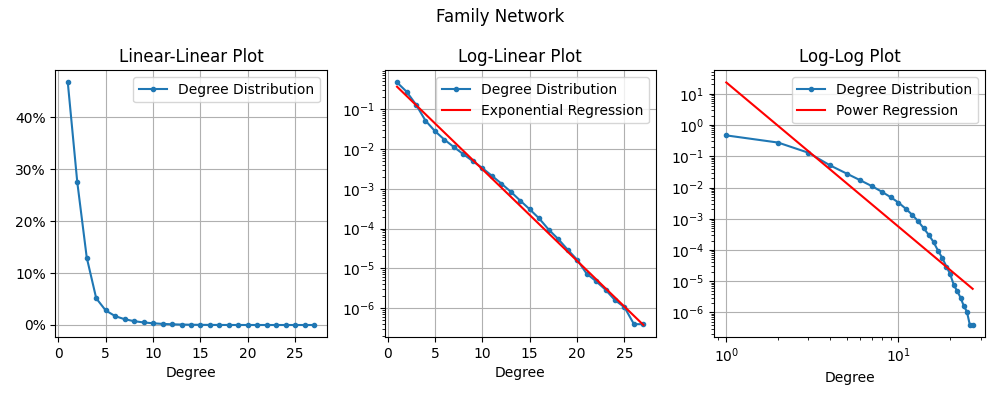
Wow, wow wow wow. Look how well that Exponential Regression fits the Degree Distribution! Certainly it is not perfect (the blue line wobbles a bit), but compared to all the other regression lines we’ve seen, this one fits like a glove! So this is my first discovery: The WikiTree Family Network has Exponential Degree Distribution. In fact, this is what convinced me that the Family Network was worth considering further.
Exponential Degree Distribution
So … what does that mean? Honestly, I’m not sure yet. Ever since I discovered this fact about a month ago, I have been frantically trying to read everything I can about Exponential Degree Distributions. The fit is so good, that I feel like it must say something about our network.
The best I’ve been able to find so far is section 2.1 and 5.1 of the book “Evolution of Networks” by Dorogovtsev and Mendes in which they discuss how exponential networks can be grown via a process I will call “Random Attachment” in which we grow a network by repeatedly adding nodes and then connecting them to a random pre-existing node (without any preference).
This contrasts with the much more famous process of “Preferential Attachment” in which the added nodes are “preferentially” attach to nodes that have higher degree (the rich get richer). Preferential attachment appears to be an extremely popular theory in the Network Theory literature and it leads to a Power-law Degree Distribution.
Preferential attachment makes a lot of sense in other well studied networks: citations of published research papers; webpages and their hyperlinks; the network of actors who have worked together on films. In all of these cases, a popular node (often cited paper; highly linked to webpage; popular actor) is more likely to be linked to from a new node (new paper; new webpage; new movie). All of these networks have been shown to be power-law networks (also called “Scale-free networks”).
However, in contrast, WikiTree is a bit different. Certainly there seems to be some level of preferential treatment (a person with a large family already on WikiTree is probably more likely get further research as more relatives discover their profile and add details). However, when it comes to the degree of that node (the number of family members) this cannot grow forever! At some point there will be no more family to add because they will all already be on WikiTree.
So could it be that the WikiTree Person Network is being created by some sort of “Random Attachment” process? I don’t know. Continue on this adventure with me and perhaps we will discover the answer.
(Comments and discussion at WikiTree G2G)
This article is part of a series on the WikiTree Network:
-
WikiTree Network Degree Distribution